Using Node-RED#
Node-RED provides a browser-based editor that makes it easy to wire together flows using the wide range of nodes in the palette that can be deployed to its runtime in a single-click.
Pre-requisites#
Note
If you’re using the official Beagleplay debian image then you most likely can skip the Install Node-RED step.
Install Node-RED using the official guide here
MikroE Accel click or any mikroBUS add-on
Let’s get started!#
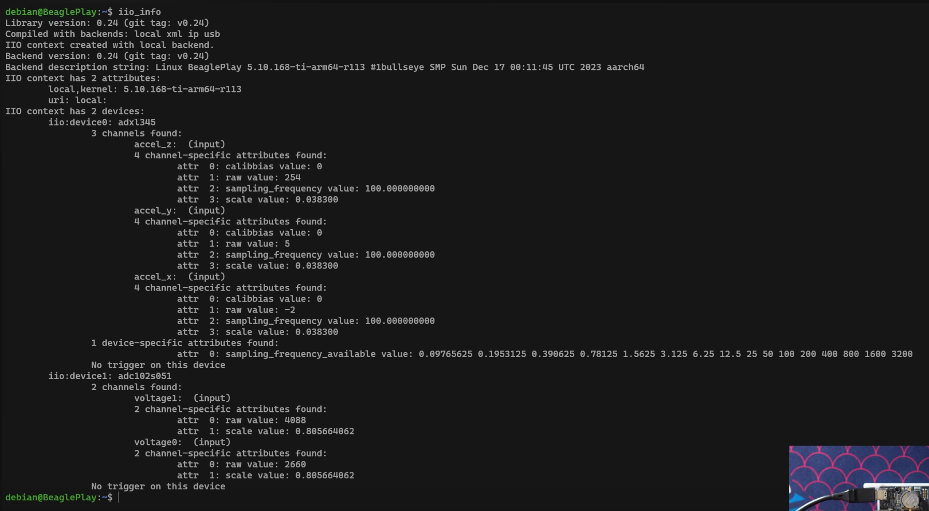
First, we want to make sure the mikroBUS™ add-on board is connected and functioning as expected. To do this, we make use of the iio_info command.
Connecting mikroBUS™ add-on board#
iio_info is a utility for displaying information about local or remote IIO devices, in this case it’s the Accel click board.
Accessing Node-RED#
Once your BeaglePlay is booted up and connected to your computer, access it from your browser by typing
192.168.7.2:1880 in your address bar.
Creating a basic flow#
In this flow we’ll take a look at how we can get the accelerometer readings output on the node red console.
First, let’s insert the exec function block. This will help us capture a linux command from
an entry like /sys/bus/iio/....
Double click on the function block and in the command paste:
cat /sys/bus/iio/devices/iio\:device0.../in_accel_x_raw
Give it some name and press Done.
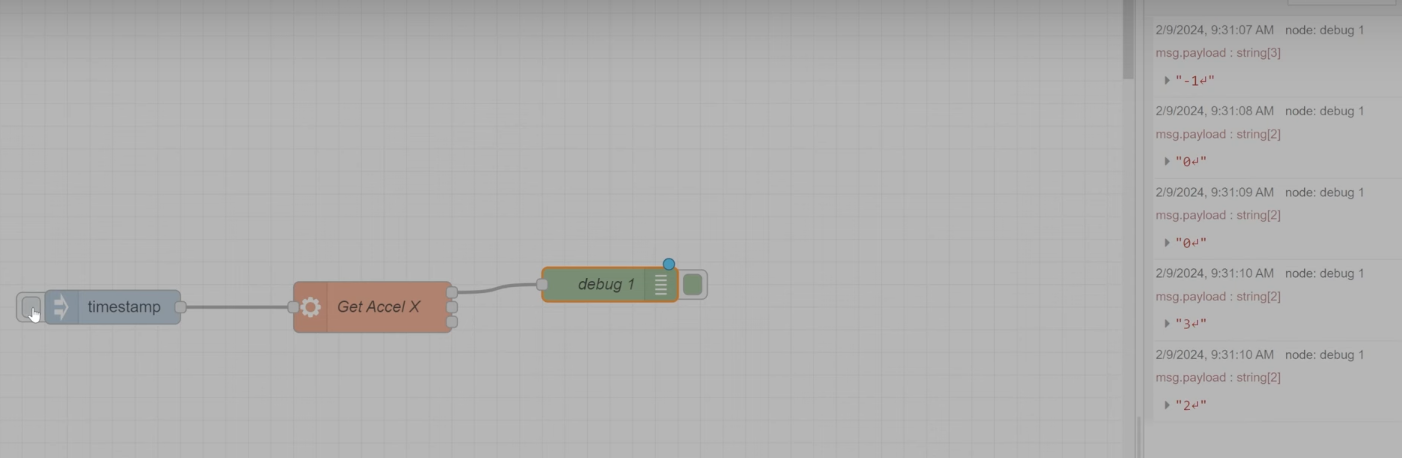
Next, we add the “Debug” node and connect it to the previous function block we made to get the output.
Optionally, as shown in the video we can also “Inject” a timestamp into the function block which will then go into the debug console to give us the logs with timestamps.
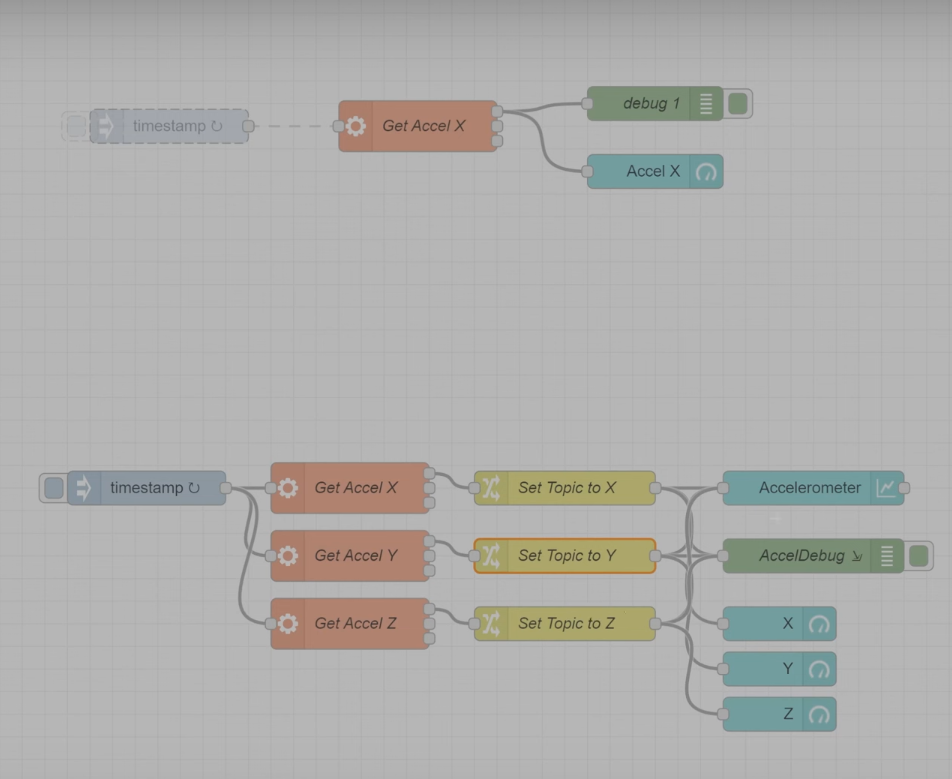
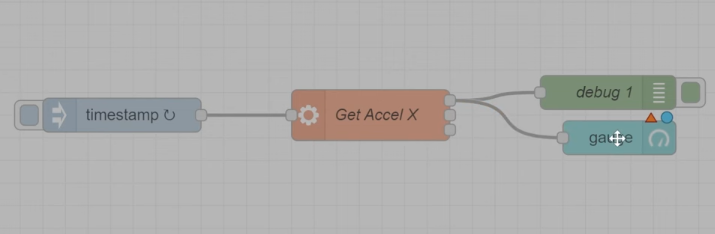
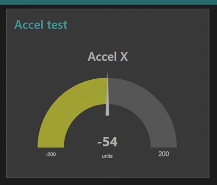
Adding a Gauge#
Adding a Graph and 3 Axis#
Todo
Add flow diagram
Show the output